The Debug heap that created bugs
Aka:Story of one man-month of development lost due to a bug in a debugging tool.

Update Jan 3, 2020: The bug is also present with single-threaded applications.
Memory corruption
Memory corruption can be hard to track, especially when you have a multithreaded application with features that makes it hard to reproduce. This is generally the case for games, where thousands of factors can make a race condition appear, or not. Framerate could be unstable, the GPU could take a bit more time than usual to render, something being streamed from the internet took a bit longer than usual. Even without all those reasons, you might want tools that help you debug those issues.
There are quite a few available that can help you detect memory corruption and race conditions. One such tool on Windows is AppVerifier, it has a good number of features and one of those is the debug heap. It seems that it does a bit more than just enabling the gflags Page Heap Verification, and can hook functions such as HeapAlloc.
The Page Heap Verification can be used not only to track memory corruption but also leaks, and works with any application using new/malloc/HeapAlloc for allocations. More info on how to use it from WinDbg here.
Sounds great right? I have been using this tool for a while now. But the last time I used it, I had issues finding where the bug it detected came from.
A seemingly inconsistent crash
I usually fire up WinDbg to find the cause of the crash, so that I can easily inspect the memory that was corrupted. Most of the time, I saw the crash happening in DirectX or in the GPU driver. Usually, this does not sound good. I also sometimes had this particular crash in libcurl. For a while I couldn’t figure out what the issue was. Callstacks had nothing in common but somehow, it was not random. A few callstacks kept appearing in those two libraries. At first, I thought we might have had some incompatibility in libcurl with it’s allocations. I made sure we compiled it with the correct flag, set the allocation functions at init. And BAM! No more issues.
It seemed like a weird fix since libcurl allocates everything using its own functions, and is wrapped in its own .dll. But the bug disappeared. And as our QA team didn’t reproduce it unless they used AppVerifier so we decided to stop worrying about it. I spent about a week or two looking for various causes for the crash, found potential bugs in other parts so it was kind of worth it anyway.
The return of the crash
Until we had another memory corruption. As usual I fired up AppVerifier and WinDbg. After running the game a few times, I found the crash we were looking for. However I did also encounter the old DirectX crash once. It was not gone… So I fixed one issue. Then another. Used static analysis tools, other applications such as Intel Inspector, coded my own page guards using VirtualAlloc, but nothing really helped me find it. I kept disabling gameplay features, but the bug stayed. And was most of the time getting harder to reproduce.
I did have a few suspects though, I knew that the problem was that memory allocated through HeapAlloc with HEAP_ZERO_MEMORY had parts not set to zero. And the issue I had in libcurl was similar: memory allocated with calloc was not zero-filled.
I looked for ages where this could be triggered from. Most of the time, the value was filled with 0xCC, 0xCD, or 0xD0. Which meant uninitialized memory or freed memory. More patterns can be found here
And so I assumed there was a use after free somewhere. My hypothesis was the following:
- Thread A frees the memory
- Thread B allocates memory, asking it to be zero-filled, and gets the same address
- Thread A does a use-after-free
- Thread B reads memory that should have been null but is not, and we get an invalid pointer.
And that’s where I made a mistake. I thought that my tooling was bug-free. But let’s get back to the problem.
A reach for help
At some point, unable to find the source of the bug, I sent a mail to the DirectX team with a (huge) crashdump.
I was first told it probably was a mistake on our side. I was kind of expecting this, DirectX is used in a lot of games and never showed such issue. And it only happened when using AppVerifier.
But as I explained the problem more deeply, my contact understood the issue and was kind enough to help me and investigate a bit.
Sadly for me, he confirmed that the problem was not in DirectX. However, he told me the memory was always allocated by HeapAlloc with the HEAP_ZERO_MEMORY which confirmed my earlier suspicions.
Something I did not notice was that the keyword “airport” was a bit further in the memory block. I dismissed it at first as I already saw it before and checked the only part in our code that could write such string. Or should I say array of strings. And we had a lot of those that were stored in a dynamic arrays that were getting reallocated (which made me realize we really needed a better way to store those, as we got in the ~40k duplicated strings in some cases!). And so I started to play with it, changing one letter for another before and after reallocation.
That’s how we came to the conclusion that something was wrong in the Windows heap. Crazy isn’t it? We couldn’t believe it, yet here it was. The weird part was that it didn’t seem to happen without the debug heap enabled. Or was it? So we sent a mail to the AppVerifier owner, which didn’t really believe us at the beggining. This is fair since nobody ever reported this for ages. He tried a small sample and could not reproduce, though it was a single-threaded sample. I knew our issue was a multi-threading issue, so I had to get proof backing up my claims.
Burden of proof
During the same period, I was learning how to use Microsoft’s Detours library for a side project of my own. I then decided to put this to profit, and detour the HeapAlloc function, replacing it by the simple yet effective following code:
// This will be called everywhere in the application instead of the real HeapAlloc function
DECLSPEC_ALLOCATOR LPVOID MyHeapAlloc(
  HANDLE hHeap,
  DWORD  dwFlags,
  SIZE_T dwBytes
)
{
    LPVOID memoryBlock = RealHeapAlloc(hHeap,dwFlags,dwBytes);
    const char* pMem = (const char*)memoryBlock;
    if(dwFlags & HEAP_ZERO_MEMORY)
    {
        for (size_t i = 0; i < dwBytes; ++i)
        {
            if (pMem[i] != 0)
            {
                __debugbreak();
            }
        }
    }
    return memoryBlock;
}
Start the game with Detours and AppVerifier, et voilà! The debug breakpoint was triggered, and only if the AppVerifier debug heap was enabled. This was enough proof for me to conclude the culprit was indeed AppVerifier, but it would be nice if we could reproduce it easily, right?
So I made a minimal, reproducible example. The latest version is the following:
What it does is spawn 2 threads, one that does a lot of allocations and reallocations, the other calling HeapAlloc with HEAP_ZERO_MEMORY in loop.
At first I used aligned_* allocation functions since that’s what we were using in our game.
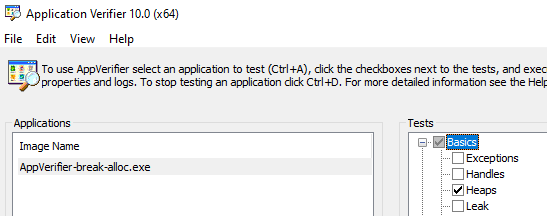
To enable Appverifier, add your application to the list, and for the debug heap check Basics -> Heaps as shown below:
You will note that AppVerifier will trigger the breakpoint for all define configurations except AllocMethod_malloc and AllocMethod_ProcessHeapNoRealloc.
This is because realloc does not call HeapReAlloc. We can safely conclude that the issue happens only when calling HeapReAlloc from a multi-threaded context (it does not happen in a single-threaded one). See the update.
Quite rare, but we were doing a lot of (re)allocations during loading, and allocating DirectX buffers on another thread so this triggered rather often on our codebase.
A bit of insight gained
That’s why I wanted to tell you that even though it rarely happens, your debugging tools might fail you! Always start by doubting your code, then your libraries, drivers, compiler, debugger, OS and lastly your hardware. Those things do happen, and remember that a debugging tool is still software and not always bug-free!
For people with access to the Microsoft bug database (I don’t) this is registered as bug #22979026, I also hope it can get fixed at some point as AppVerifier is a very useful tool.
For those who still want to use it and might have the same issue, know that you can write a small detours .dll that will do the zero-fill no matter what.
Maybe a topic for a future post?
Update following discussions again
@MSFTJesse (see reddit comment) kindly sent a time travel debugging trace to the AppVerifier team, and after speaking a bit with him we determined the issue was actually (a bit) worse as it also happens in a single-threaded context.
I updated the sample code with a TestIsSingleThread define that also triggers the breakpoint. I left the multi-threaded version of the test for reference.
Note that we could probably reduce the code again, but the faulty code seems to have been located so I won’t bother with it.
Hopefully the fix will land soon!
Reddit thread for comments.